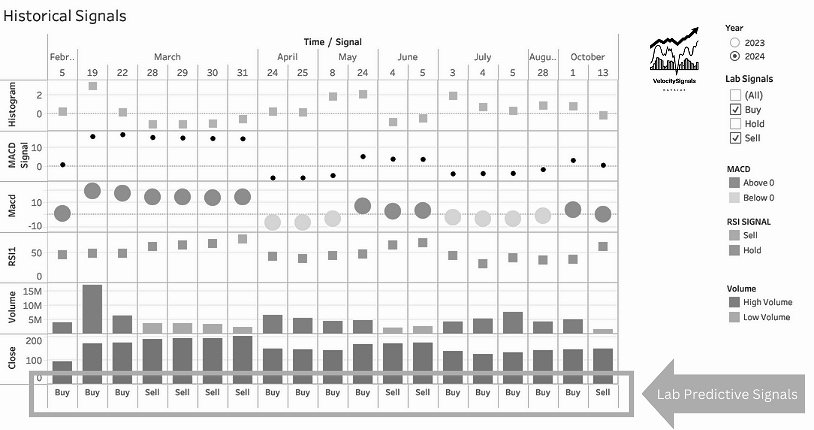
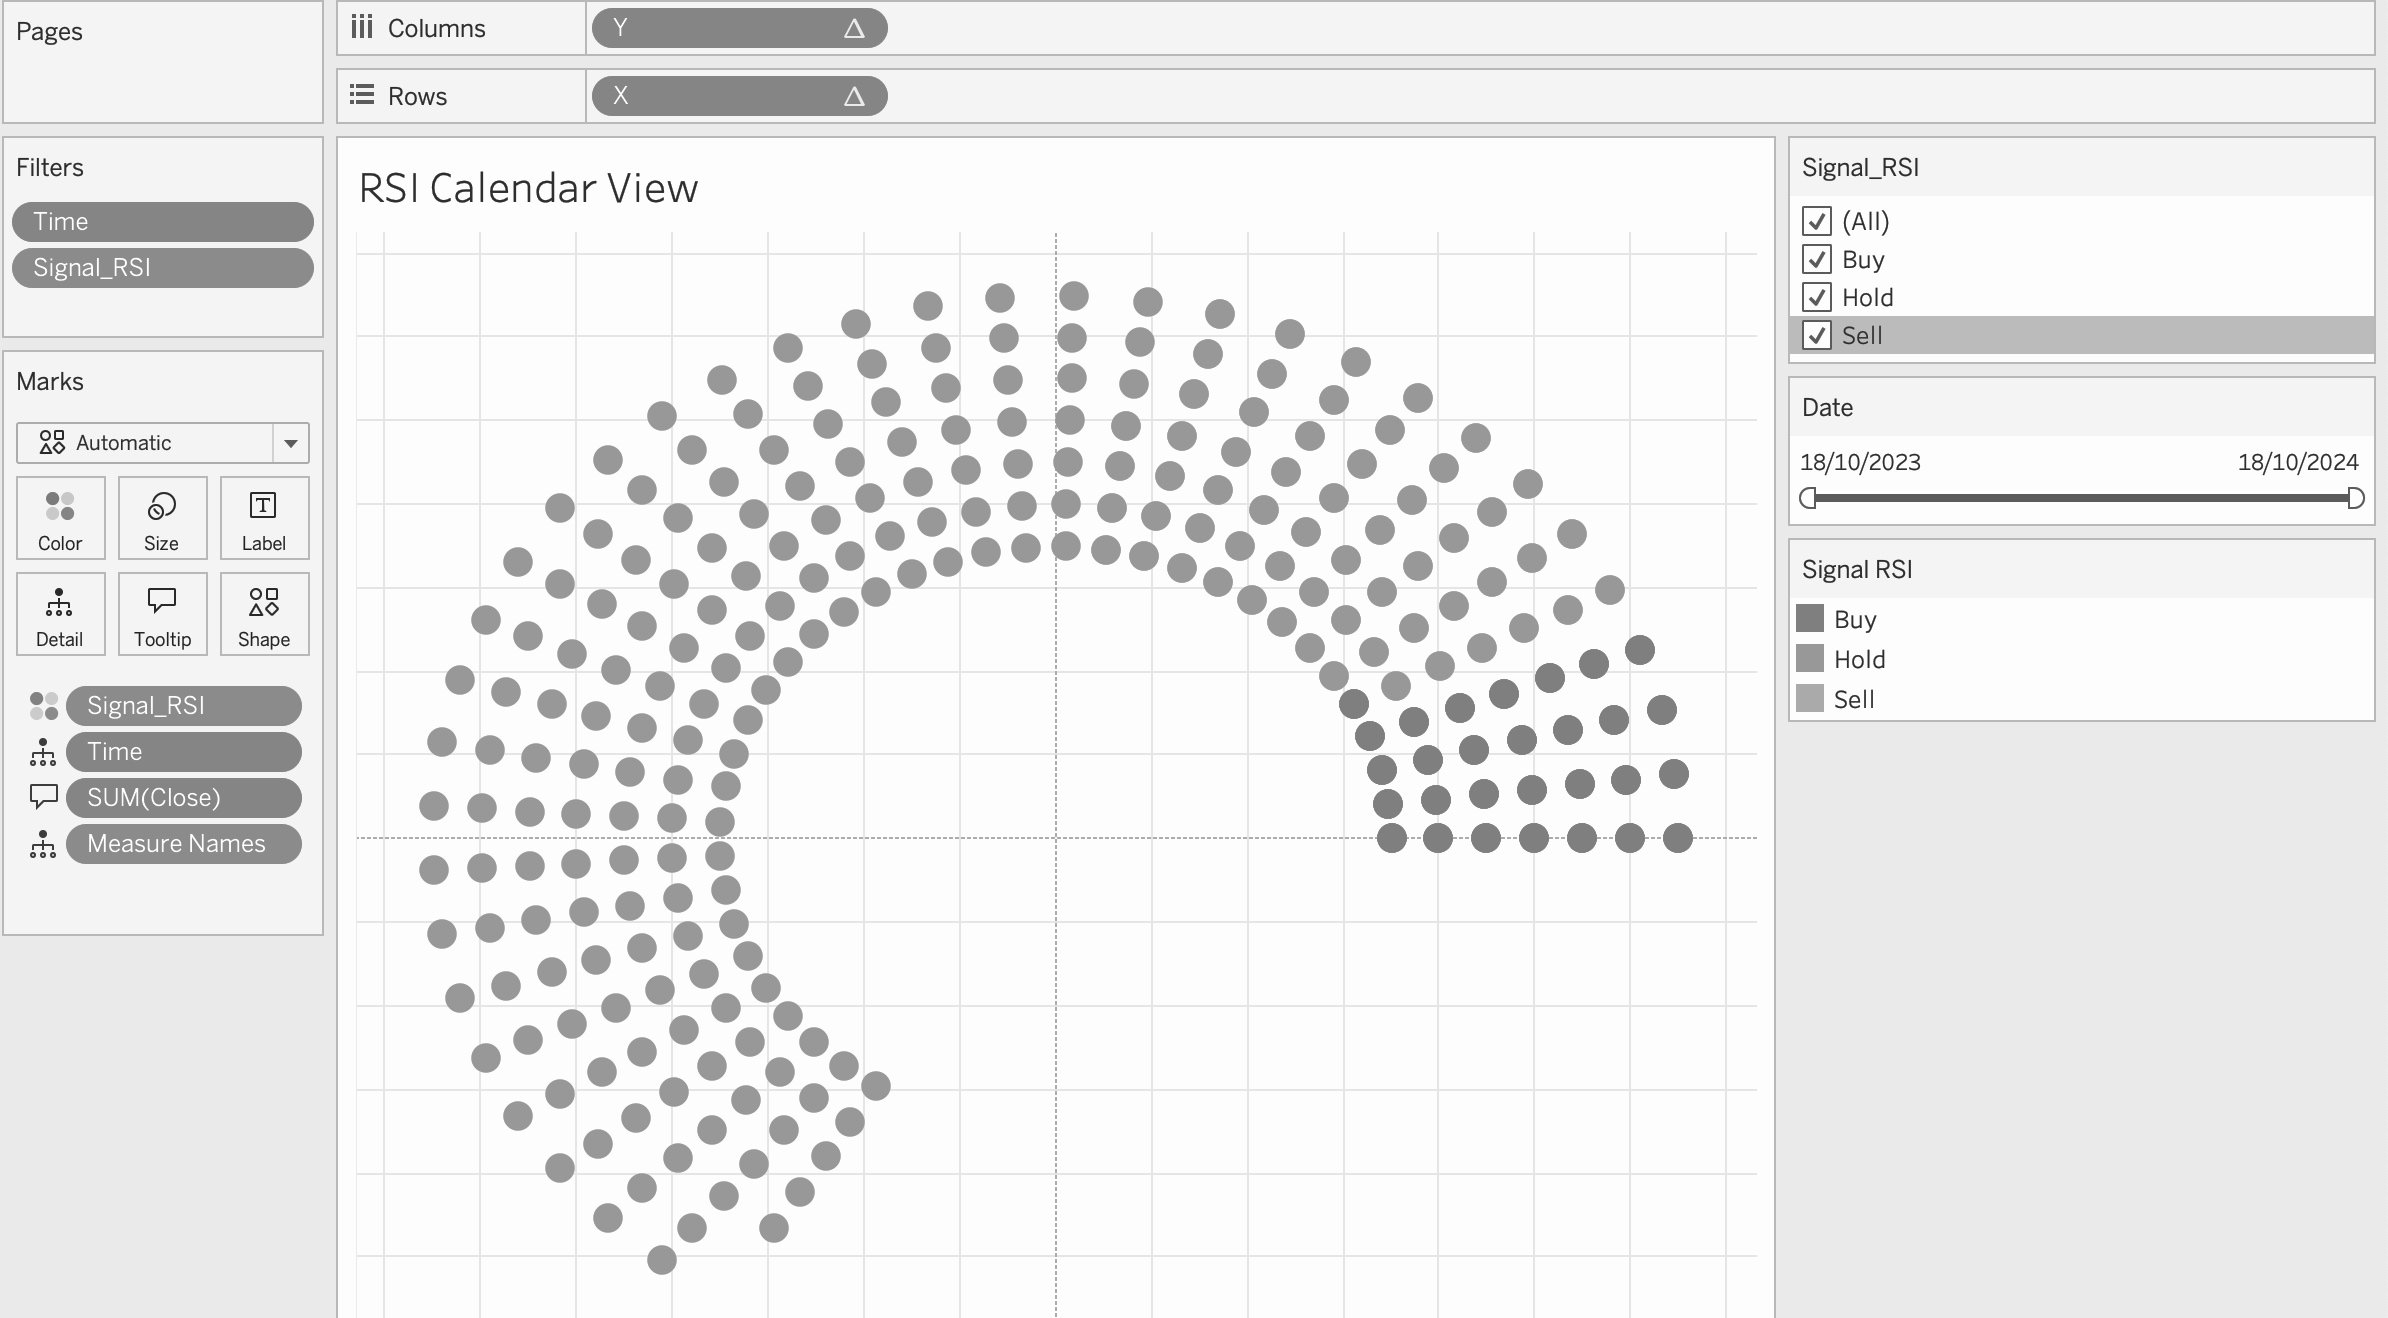
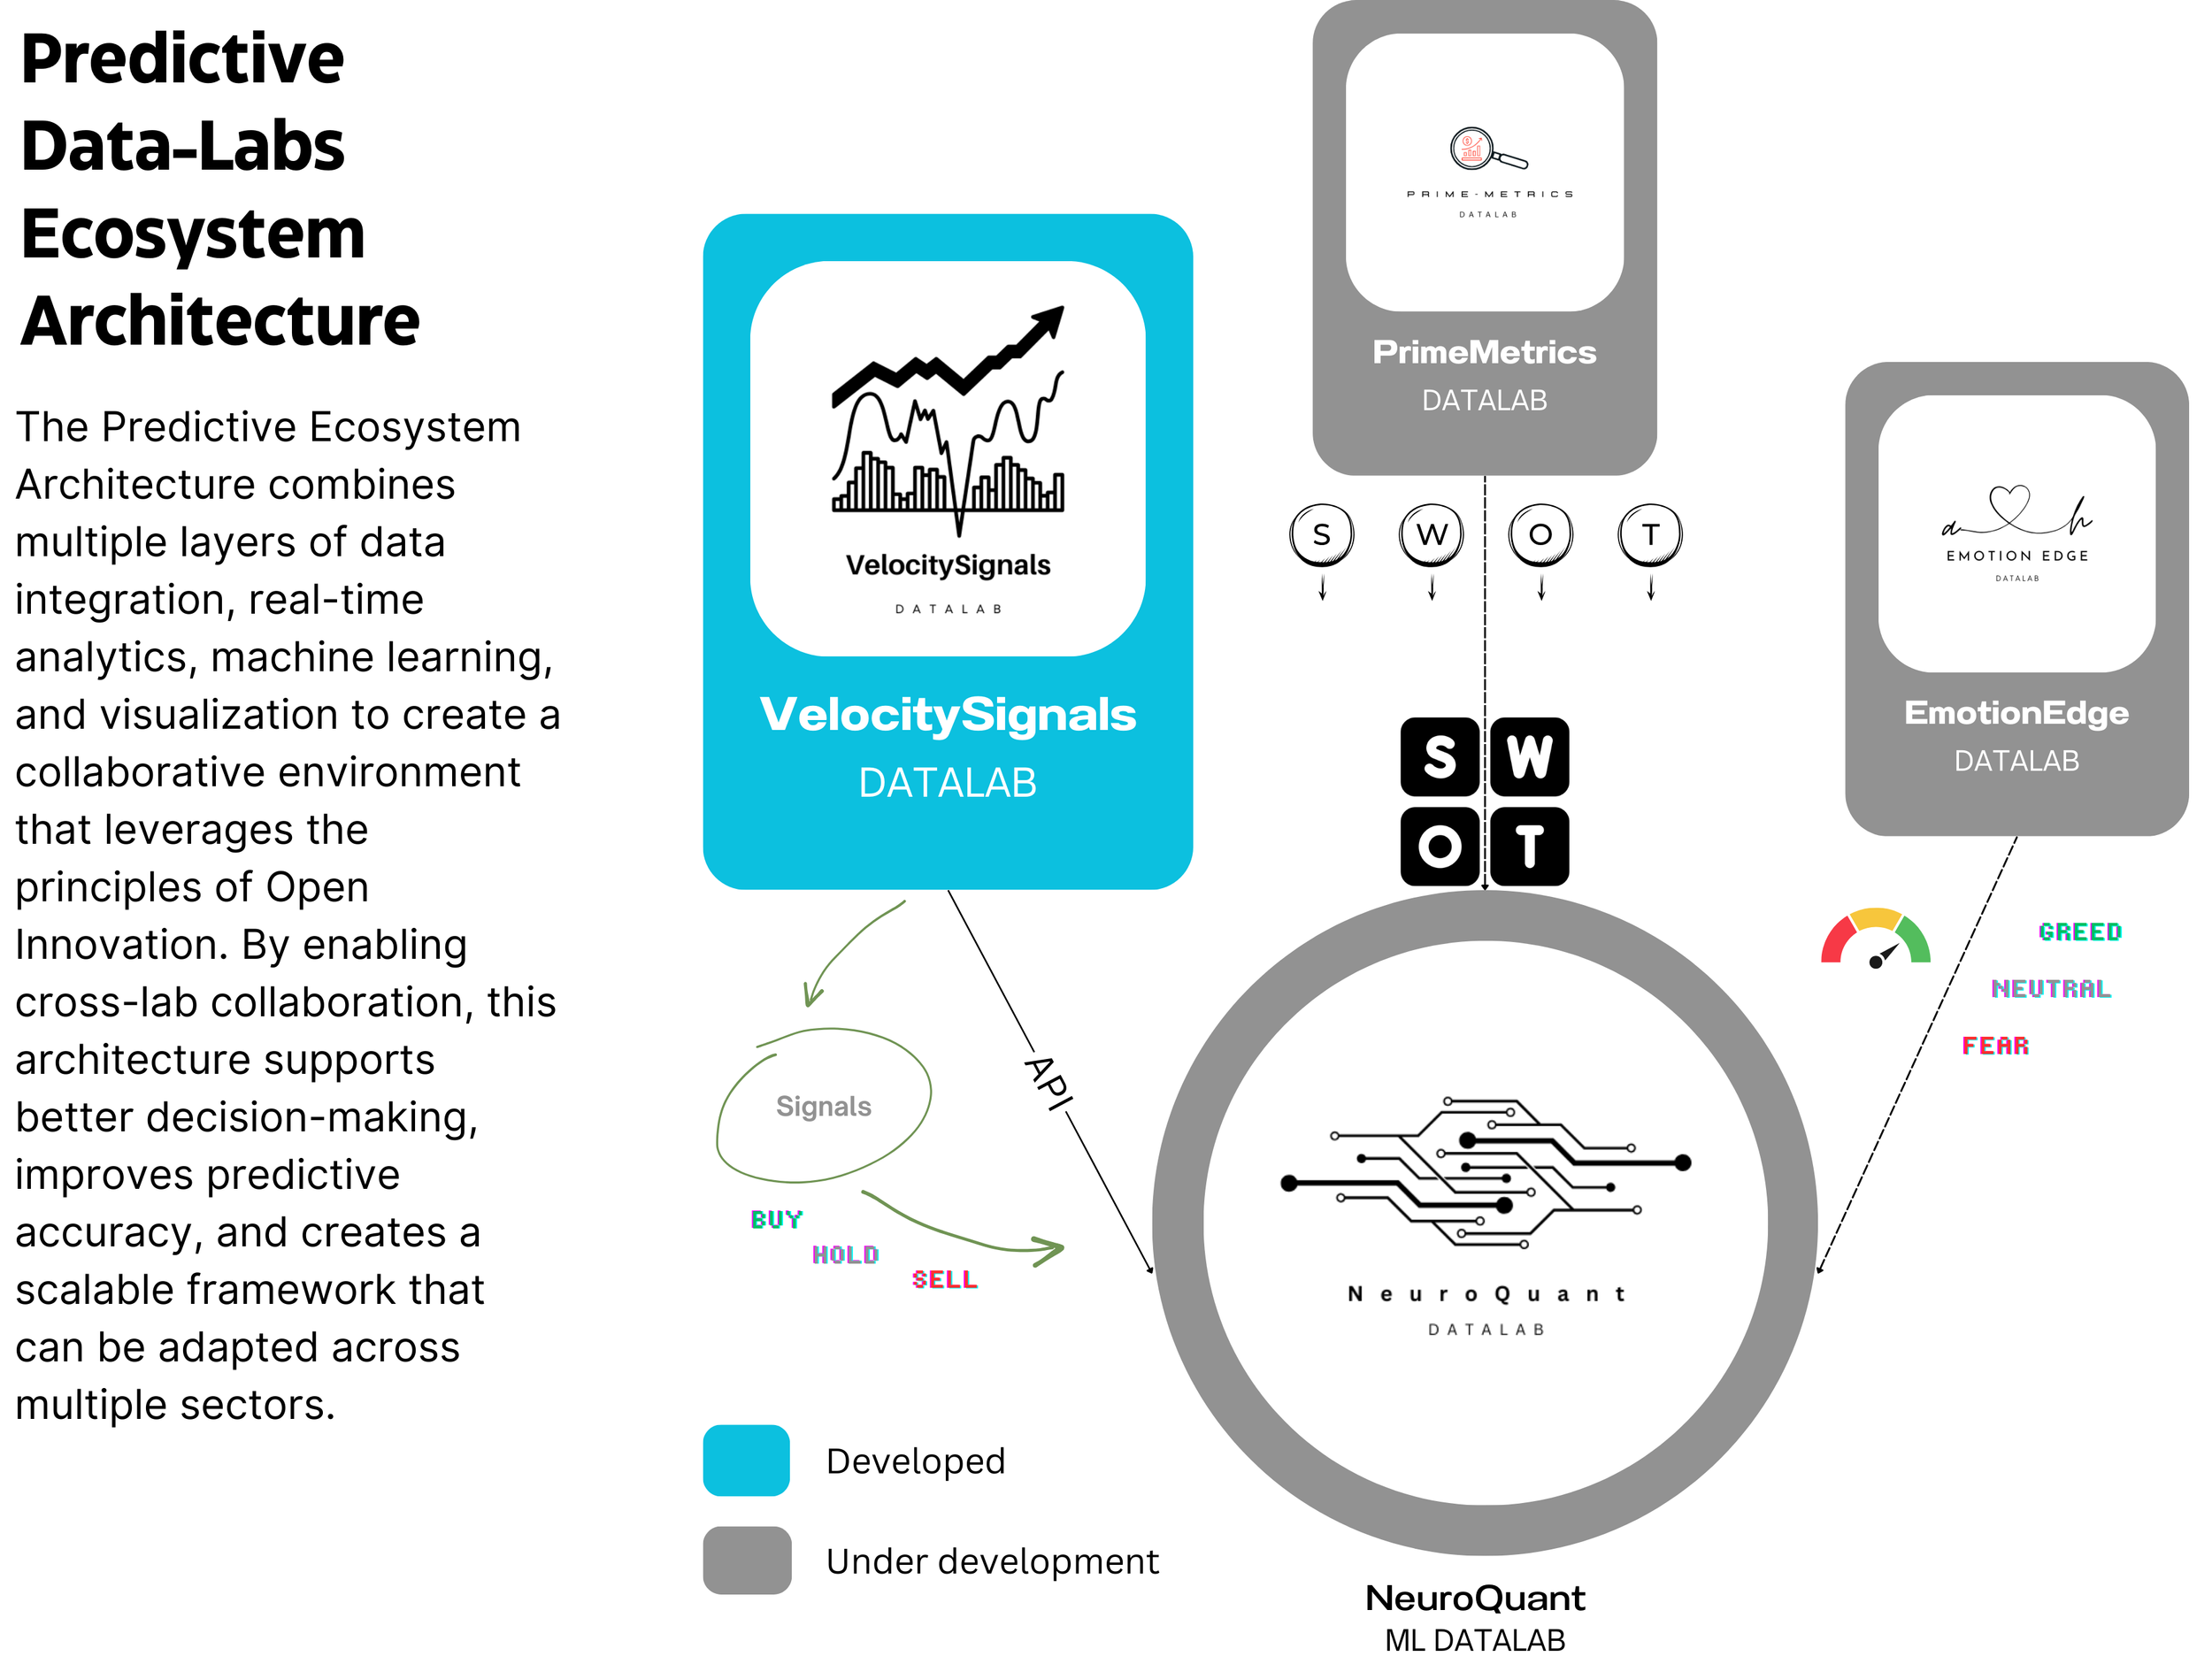
In VelocitySignals Lab, I use advanced technical indicators like RSI, MACD, and trading volume to analyze and predict market movements. The lab generates clear buy, sell, or hold signals based on historical datasets, helping me make intelligent, data-driven decisions. With integrated predictive algorithms, it’s possible to anticipate market trends and respond quickly, empowering trading strategies with a forward-looking approach.
What is a predictive data lab?
A data lab is a multidisciplinary, experimental environment to extract insights from datasets. Data labs are not merely analytical spaces; they are innovation hubs designed to solve complex problems using data-driven approaches. A Predictive Data Lab is a specialized environment focused on building and refining models that forecast future outcomes. Unlike traditional data labs, which may center on analyzing past trends, a predictive data lab is also dedicated to anticipating future behaviors and trends using advanced techniques such as machine learning, AI, and statistical modeling. These labs are designed to test and validate predictive models, enabling researchers and organizations to make proactive, data-driven decisions and respond to potential challenges before they arise. Ultimately, a Predictive Data Lab transforms raw data into forward-looking insights, driving innovation and strategic growth.
Want to dive deeper into data labs and their impact on predictive analytics? Click here to read my paper on Data Labs and Prediction Analytics.
How the labs are built…
When it comes to tackling complex problems through research, I rely on a structured yet flexible approach that allows me to transform raw data into meaningful insights.
Over the years, I’ve honed a 5-step research framework that helps me not only gather and process data efficiently but also apply it to real-world decision-making. Here’s how I do it.
5-step research framework
Step 1: Defining the Problem
Pinpoint the Core Issue: This isn’t about broad strokes—it’s about narrowing down exactly what needs solving. Whether I’m predicting stock movements, crafting a SWOT analysis, or analyzing market forces through PESTEL, I ensure every decision I make is grounded in a sharp understanding of the problem.
Identify Key Variables: I break down the problem into key variables that can be measured, modeled, or observed. For instance, in stock prediction, it could be price trends, volume, or RSI, while in SWOT it might focus on revenue growth or external threats.
Establish Hypotheses: I formulate specific hypotheses that my analysis will test. For example, I might hypothesize that NVIDIA’s market dominance will hold if AI chip demand continues to grow. This gives my work direction and intent.
Visualize the final user interaction and experience. Prototyping.
Step 2: Building the Data Lab Infrastructure
Choose Data Sources Wisely: The quality of insights is only as good as the data feeding them. I select data sources based on reliability and relevance—be it stock data from TradingView, financial reports, or unstructured data from news and earnings calls. Each data source must serve a purpose in solving the problem at hand.
Design the Data Pipeline: It’s not just about gathering data—it’s about automating the entire data pipeline. I set up cloud infrastructure, typically with Google Cloud or AWS, to automate collection, storage, and retrieval. This step requires ensuring the data flows seamlessly from sources to databases, with checks in place for accuracy and real-time updates.
Ensure Scalability and Flexibility: I build infrastructure that can scale as more data comes in. This means using tools like BigQuery for rapid querying and Google Cloud Storage for handling unstructured data. Flexibility is important, so I make sure the setup can accommodate future growth in both data volume and complexity.
Step 3: Exploring and Preprocessing the Data
Data Cleaning and Transformation: Data is often messy and typically requires cleaning up duplicates, filling in missing values, and standardizing formats. When working with financial reports, this process involves parsing and transforming text into structured sections—such as financials, risks, and opportunities—using NLP models.
Perform Exploratory Data Analysis (EDA): Here, I dig deep into the data to uncover trends, outliers, and hidden patterns. Using Pandas and Matplotlib, I visualize stock trends, analyze volatility, and assess RSI to determine oversold conditions. In qualitative data, I conduct sentiment analysis across news sources to see how market sentiment may affect stock prices or business strategies.
Feature Engineering: I transform raw data into meaningful features that are ready for machine learning models. For instance, I could derive technical indicators like moving averages, volatility metrics, or revenue-to-expense ratios. These features form the backbone of later predictive models and decision-making tools.
Document Key Findings: As I explore, I document insights that may be valuable down the line. For example, during EDA, I might find that stock volatility spikes just before major product announcements. These observations guide further analysis.
Step 4: Analyzing and Modeling the Data
Apply Predictive Models: With clean and well-structured data. In the Prediction Lab, I use techniques like LSTM for time-series forecasting, which helps me predict NVIDIA’s stock movement based on historical price trends and technical indicators.
Leverage NLP and LLMs: For the Insights Lab, I use GPT-4 and NLP tools to analyze unstructured data, like annual reports and market news, extracting key information that influences strategic insights. This allows me to dissect qualitative information and turn it into measurable insights.
Simulations and Scenario Analysis: This is especially important for stress-testing different growth scenarios for NVIDIA based on market conditions, trade disruptions, or shifts in AI adoption.
Backtesting Models: To validate my models, I run backtesting against historical data to ensure they accurately predict outcomes. This step is crucial for ensuring that my predictions and recommendations are reliable and not just theoretical.
Step 5: Turning Insights into Actionable Reports
Synthesize Findings: All the analysis means nothing if I can’t distill it into something useful. I take the raw predictions and strategic insights and package them into actionable, easy-to-understand conclusions.
Build Interactive Dashboards: Using Tableau or Power BI, I create interactive dashboards that allow decision-makers (or me, in personal investing) to see the big picture. Whether it’s stock trends, SWOT insights, or market risks, these dashboards are dynamic tools that visualize data in a way that’s easy to interpret.
Create Strategic Reports: The final report includes an executive summary, a deep dive into key insights (e.g., NVIDIA’s revenue growth trends vs. market expectations), and strategic recommendations grounded in data. I make sure that every insight ties back to the original problem statement and offers clear actions.
Present Results: Presentation matters. I not only deliver the data in visual formats but also tailor reports to the audience, whether it’s for internal decision-making or external clients. Each insight is presented with the relevant data backing it up, and I provide a roadmap for implementing the recommendations. Visit my Industry Reports page for further examples of my work.